Hardiness zone: Difference between revisions
Region defined by minimum temperature relevant to the plant survival
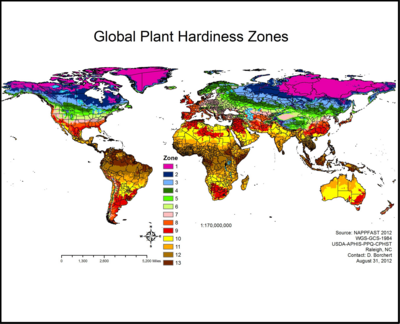
A hardiness zone is a geographic area defined as having a certain average annual minimum temperature, a factor relevant to the survival of many plants. In some systems other statistics are included in the calculations. The original and most widely used system, developed by the United States Department of Agriculture (USDA) as a rough guide for landscaping and gardening, defines 13 zones by long-term average annual extreme minimum temperatures. It has been adapted by and to other countries (such as Canada) in various forms.
Unless otherwise specified, in American contexts “hardiness zone” or simply “zone” usually refers to the USDA scale. For example, a plant may be described as “hardy to zone 10”: this means that the plant can withstand a minimum temperature of 30 °F (−1.1 °C) to 40 °F (4.4 °C).
Other hardiness rating schemes have been developed as well, such as the UK Royal Horticultural Society and US Sunset Western Garden Book systems. A heat zone (see below) is instead defined by annual high temperatures; the American Horticultural Society (AHS) heat zones use the average number of days per year when the temperature exceeds 30 °C (86 °F).
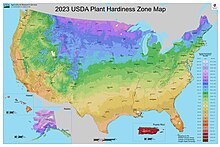
United States hardiness zones (USDA scale)


The USDA system was originally developed to aid gardeners and landscapers in the United States.
State-by-state maps, along with an electronic system that allows finding the zone for a particular zip code, can be found at the USDA Agricultural Research Service (USDA-ARS) website.
In the United States, most of the warmer zones (zones 9, 10, and 11) are located in the deep southern half of the country and on the southern coastal margins. Higher zones can be found in Hawaii (up to 12) and Puerto Rico (up to 13). The southern middle portion of the mainland and central coastal areas are in the middle zones (zones 8, 7, and 6). The far northern portion on the central interior of the mainland have some of the coldest zones (zones 5, 4, and small area of zone 3) and often have much less consistent range of temperatures in winter due to being more continental, especially further west with higher diurnal temperature variations, and thus the zone map has its limitations in these areas. Lower zones can be found in Alaska (down to 1). The low latitude and often stable weather in Florida, the Gulf Coast, and southern Arizona and California, are responsible for the rarity of episodes of severe cold relative to normal in those areas. The warmest zone in the 48 contiguous states is the Florida Keys (11b) and the coldest is in north-central Minnesota (2b). A couple of locations on the northern coast of Puerto Rico have the warmest hardiness zone in the United States at 13b. Conversely, isolated inland areas of Alaska have the coldest hardiness zone in the United States at 1a.
Definitions

| Zone | From | To | |
|---|---|---|---|
| 0 | a | < −65 °F (−53.9 °C) | |
| b | −65 °F (−53.9 °C) | −60 °F (−51.1 °C) | |
| 1 | a | −60 °F (−51.1 °C) | −55 °F (−48.3 °C) |
| b | −55 °F (−48.3 °C) | −50 °F (−45.6 °C) | |
| 2 | a | −50 °F (−45.6 °C) | −45 °F (−42.8 °C) |
| b | −45 °F (−42.8 °C) | −40 °F (−40 °C) | |
| 3 | a | −40 °F (−40 °C) | −35 °F (−37.2 °C) |
| b | −35 °F (−37.2 °C) | −30 °F (−34.4 °C) | |
| 4 | a | −30 °F (−34.4 °C) | −25 °F (−31.7 °C) |
| b | −25 °F (−31.7 °C) | −20 °F (−28.9 °C) | |
| 5 | a | −20 °F (−28.9 °C) | −15 °F (−26.1 °C) |
| b | −15 °F (−26.1 °C) | −10 °F (−23.3 °C) | |
| 6 | a | −10 °F (−23.3 °C) | −5 °F (−20.6 °C) |
| b | −5 °F (−20.6 °C) | 0 °F (−17.8 °C) | |
| 7 | a | 0 °F (−17.8 °C) | 5 °F (−15 °C) |
| b | 5 °F (−15 °C) | 10 °F (−12.2 °C) | |
| 8 | a | 10 °F (−12.2 °C) | 15 °F (−9.4 °C) |
| b | 15 °F (−9.4 °C) | 20 °F (−6.7 °C) | |
| 9 | a | 20 °F (−6.7 °C) | 25 °F (−3.9 °C) |
| b | 25 °F (−3.9 °C) | 30 °F (−1.1 °C) | |
| 10 | a | 30 °F (−1.1 °C) | +35 °F (1.7 °C) |
| b | +35 °F (1.7 °C) | +40 °F (4.4 °C) | |
| 11 | a | +40 °F (4.4 °C) | +45 °F (7.2 °C) |
| b | +45 °F (7.2 °C) | +50 °F (10 °C) | |
| 12 | a | +50 °F (10 °C) | +55 °F (12.8 °C) |
| b | +55 °F (12.8 °C) | 60 °F (15.6 °C) | |
| 13 | a | 60 °F (15.6 °C) | 65 °F (18.3 °C) |
| b | 65 °F (18.3 °C) | ||
History
The first attempts to create a geographical hardiness zone system were undertaken by two researchers at the Arnold Arboretum in Boston; the first was published in 1927 by Alfred Rehder,[1] and the second by Donald Wyman in 1938.[2] The Arnold map was subsequently updated in 1951, 1967, and finally 1971, but eventually fell…
Read More: Hardiness zone: Difference between revisions

