

Is Zoom Video Communications (ZM) Worth Chasing in September?
Zoom Video Communications (ZM) has raised its outlook for the third quarter and expects to grow its operations in the Asia-Pacific region. Does this mean the stock is a buy now? Let’s look at the financial metrics of ZM to gauge its prospects….
Zoom Video Communications, Inc. (ZM), a leading provider of communication platforms, recently posted impressive second-quarter earnings. In addition, the company’s forecasted profits for the third quarter have outperformed Wall Street predictions, with an adjusted profit per share anticipated to fall between $1.07 and $1.09, a figure surpassing the Refinitiv analysts’ average estimate of $1.03.
Even though the company’s revenue expansion no longer matches the fourfold increase witnessed during the global pandemic, there is still a sense of optimism within ZM. The confidence primarily emanates from solid technical investments and what appears to be significant potential for growth in the Asia-Pacific region.
Considering these factors, it would be prudent to examine the trends of ZM’s primary financial indicators to understand better the potential benefits of investing in its stock.
Analyzing Zoom Video Communications’ Financial Performance Trends: Growth, Downturn, and Volatility (October 2020 – July 2023)
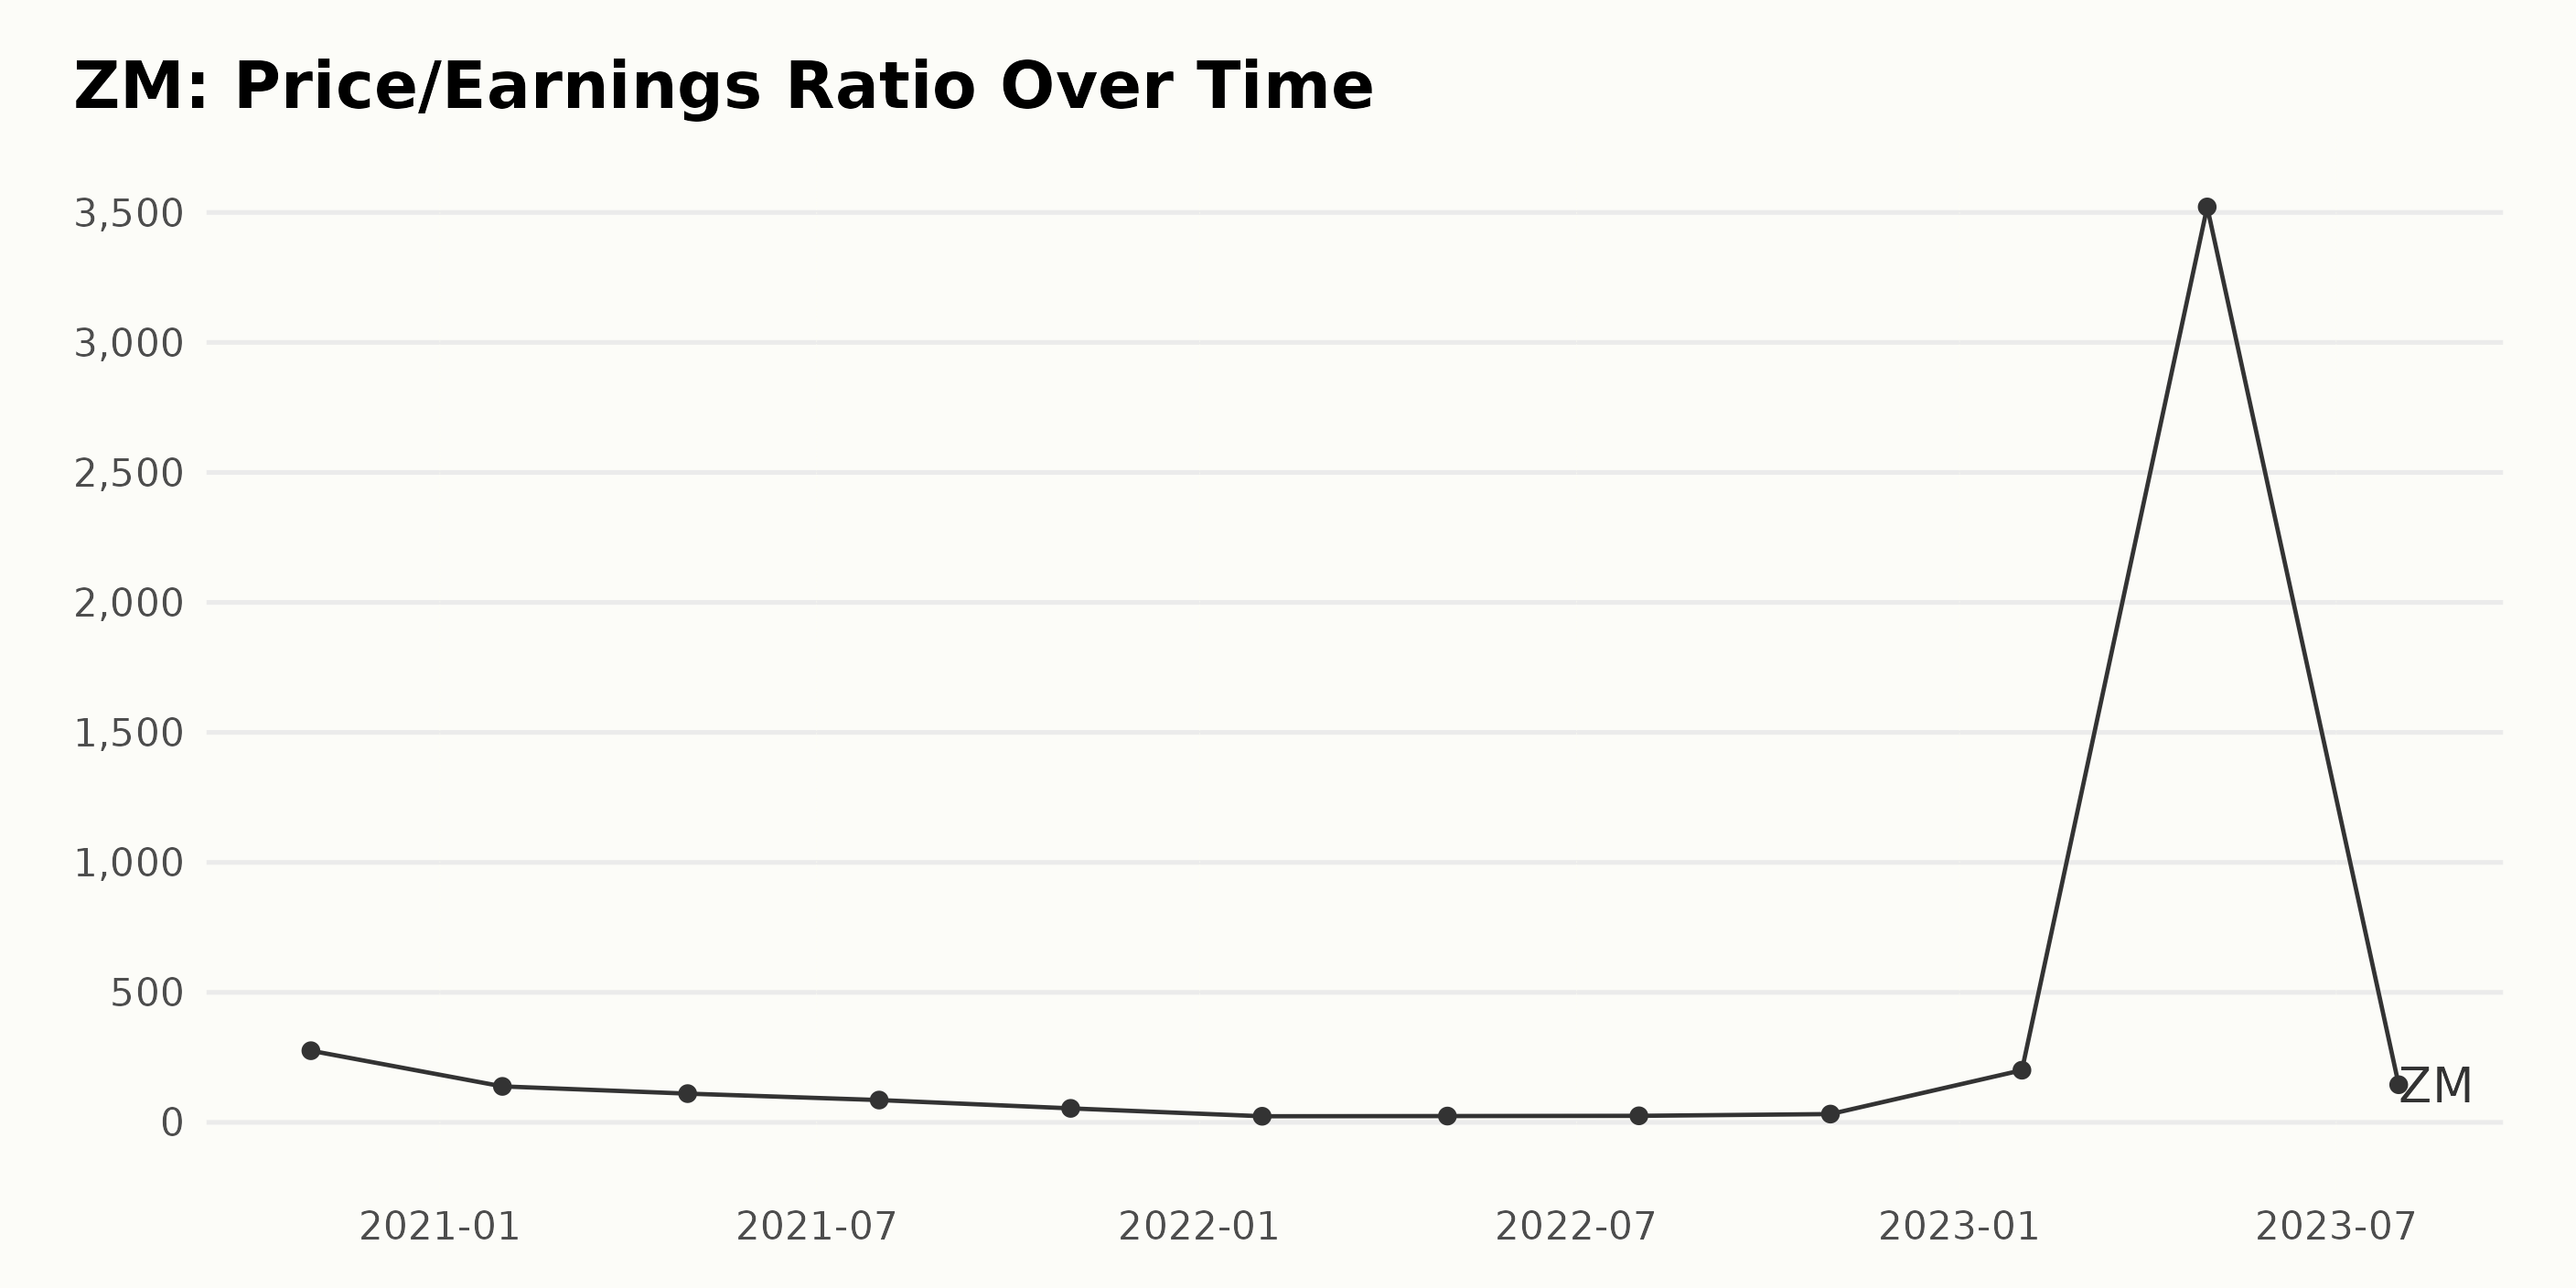
ZM’s reported Price/Earnings ratio (P/E) exhibited significant fluctuations and a trend of sharp boom and bust over the series interval. Notably, several key points clearly illustrate this trend:
- Beginning in October 2020, ZM’s P/E was notably high at 275.598.
- A consistent decline occurred over the following year, reaching a low of 23.468 in January 2022. This represents a decrease of about 91.49% from the original value in October 2020.
- A modest uptick occurred over the following months, bringing ZM’s P/E to 31.877 in October 2022.
- However, a sudden and substantial surge occurred at the beginning of 2023, skyrocketing ZM’s P/E to an unprecedented 3,521.008 in April 2023 – a growth of approximately 11,076.38% from its value in January 2023.
- As quickly as it shot up, ZM’s P/E plummeted back down to 144.755 in July 2023, reflecting yet another dramatic shift.
From the data, we understand that ZM’s P/E experienced considerable volatility, which was characterized by a significant downturn between October 2020 and January 2022, a modest recovery for the rest of 2022, an extreme surge in early 2023, and a sudden fall by July 2023.
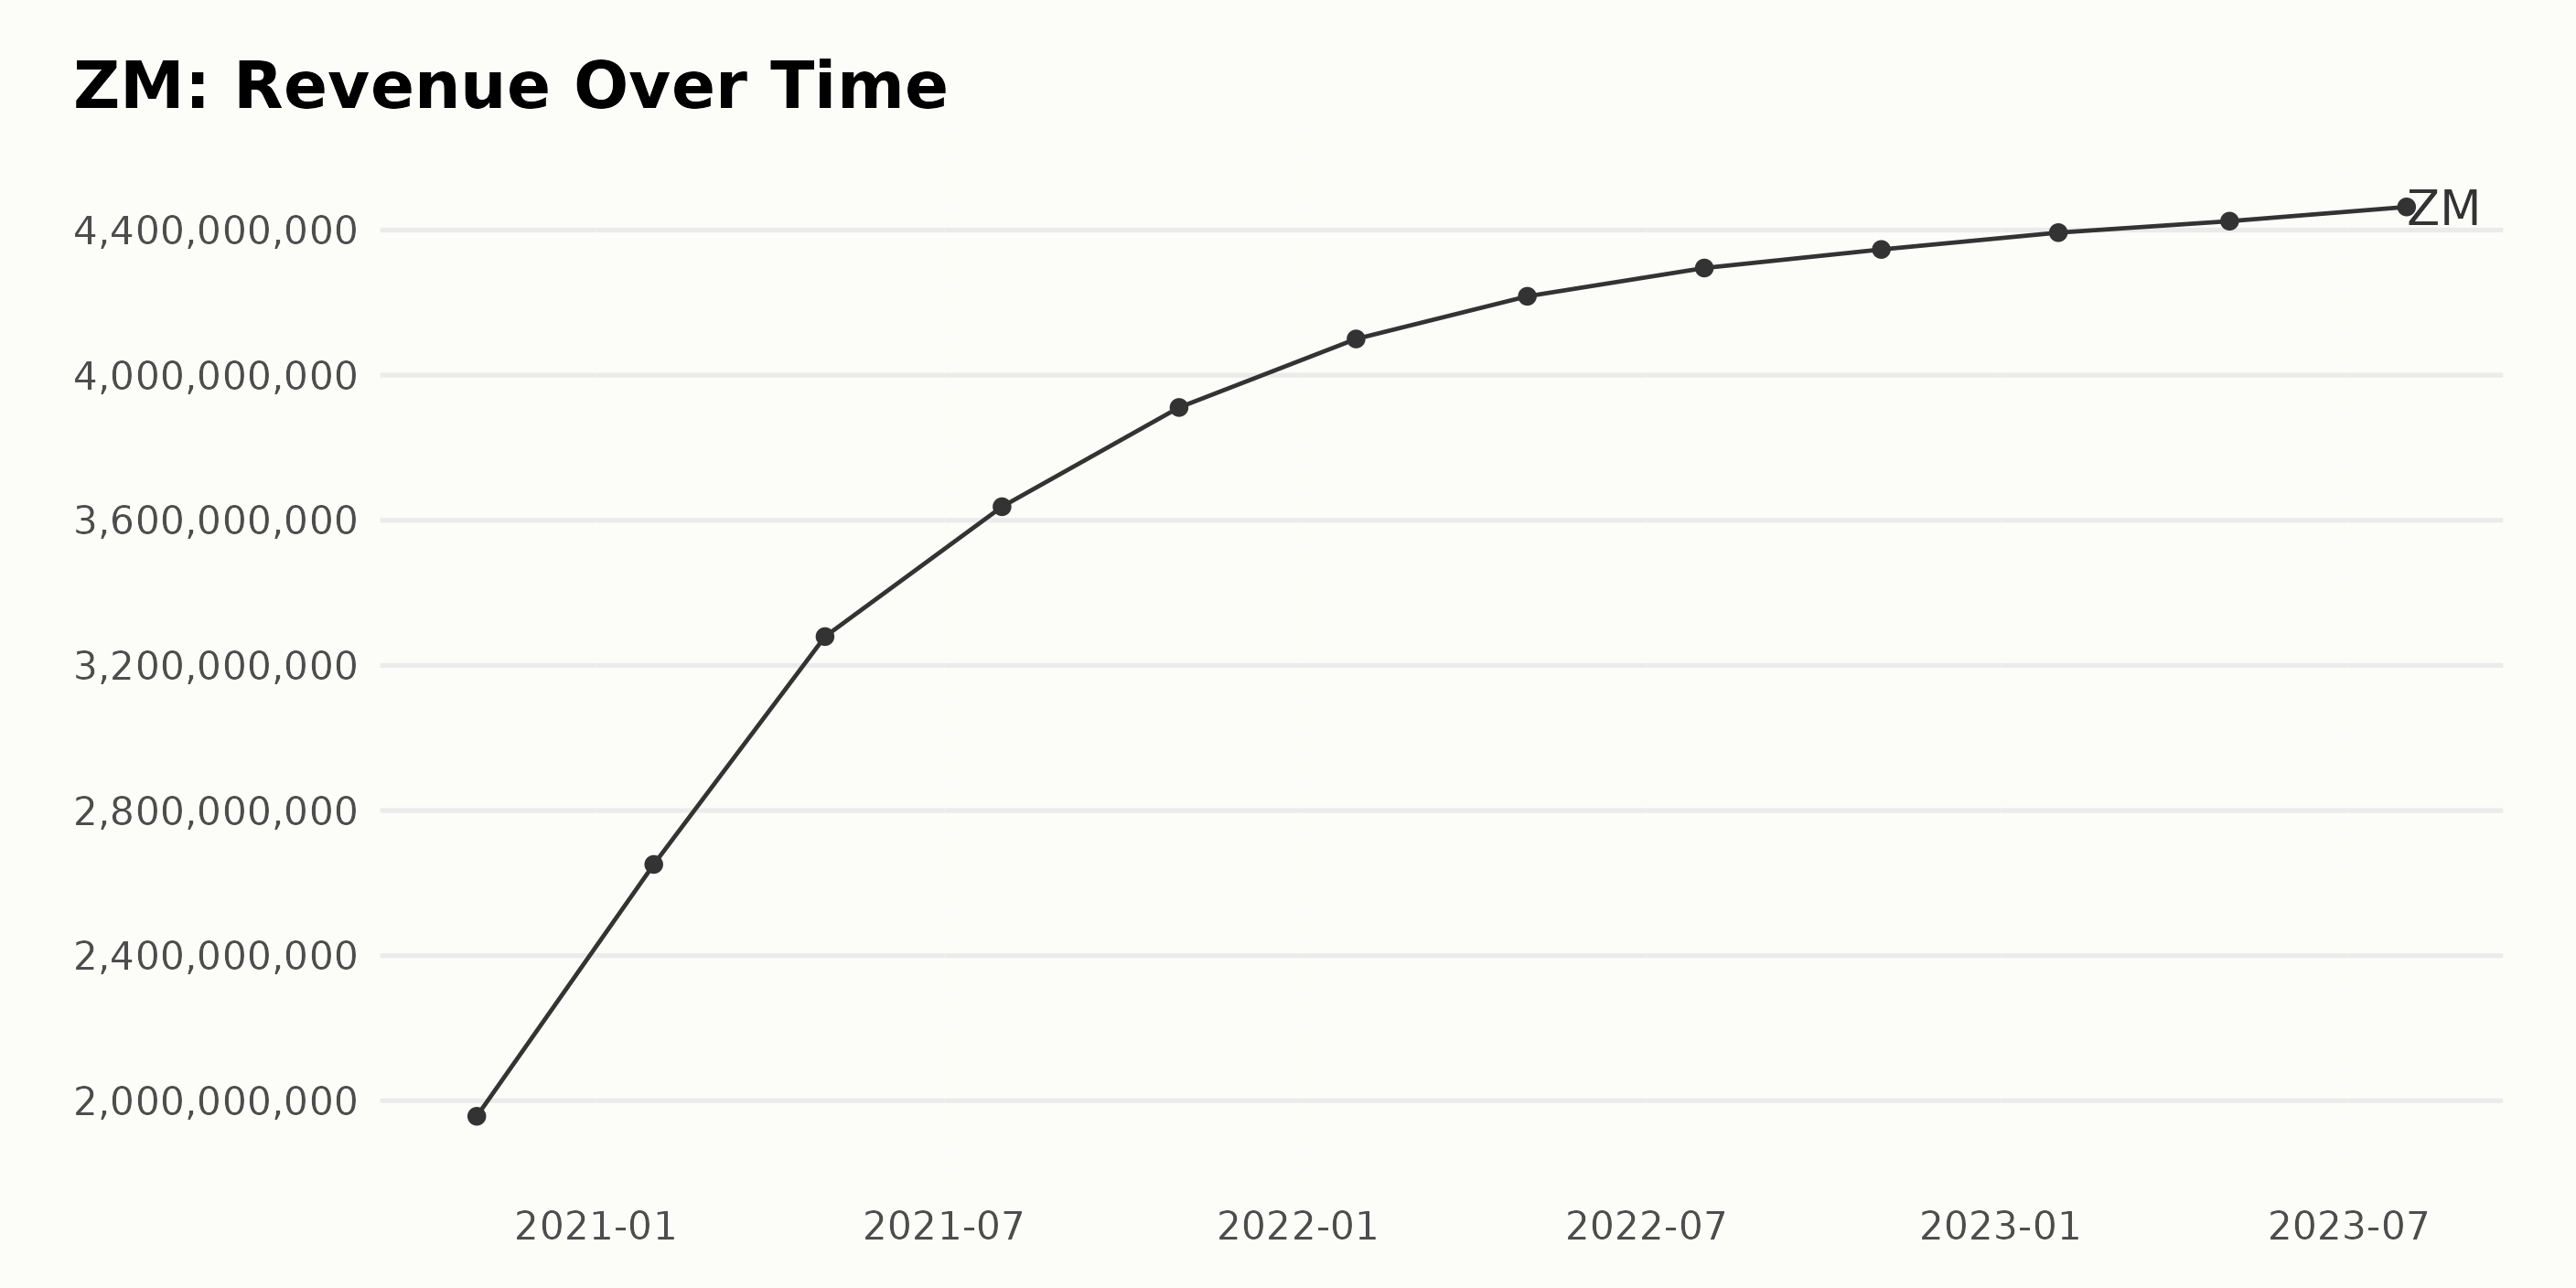
The trend and fluctuations in the trailing-12-month revenue of ZM show a largely consistent increase over the reported period, though the sharpness of the increase begins to level off gradually as we move towards more recent data. Here are notable points:
- On October 31, 2020, the revenue was $1.96 billion.
- By January 31, 2021, there was a considerable increase to $2.65 billion.
- A steady rise is observed through 2021, with an evident peak at $3.91 billion by October 31, 2021.
- The first half of 2022 showcases a somewhat slower upward trend, but the revenue still manages to rise to $4.29 billion by July 31, 2022.
- Revenue continues to grow but at a diminishing rate, reaching $4.35 billion by October 31, 2022, and $4.39 billion by January 31, 2023.
- From April to July 2023, the growth is marginal, going from $4.42 billion to $4.46 billion.
There is a substantial increase when we measure the growth rate from the first value to the last. The revenue has gone from $1.96 billion in October 2020 to $4.46 billion by July 2023. This signifies a growth of approximately 128%. This growth showcases how ZM has significantly expanded its revenue base over the period.
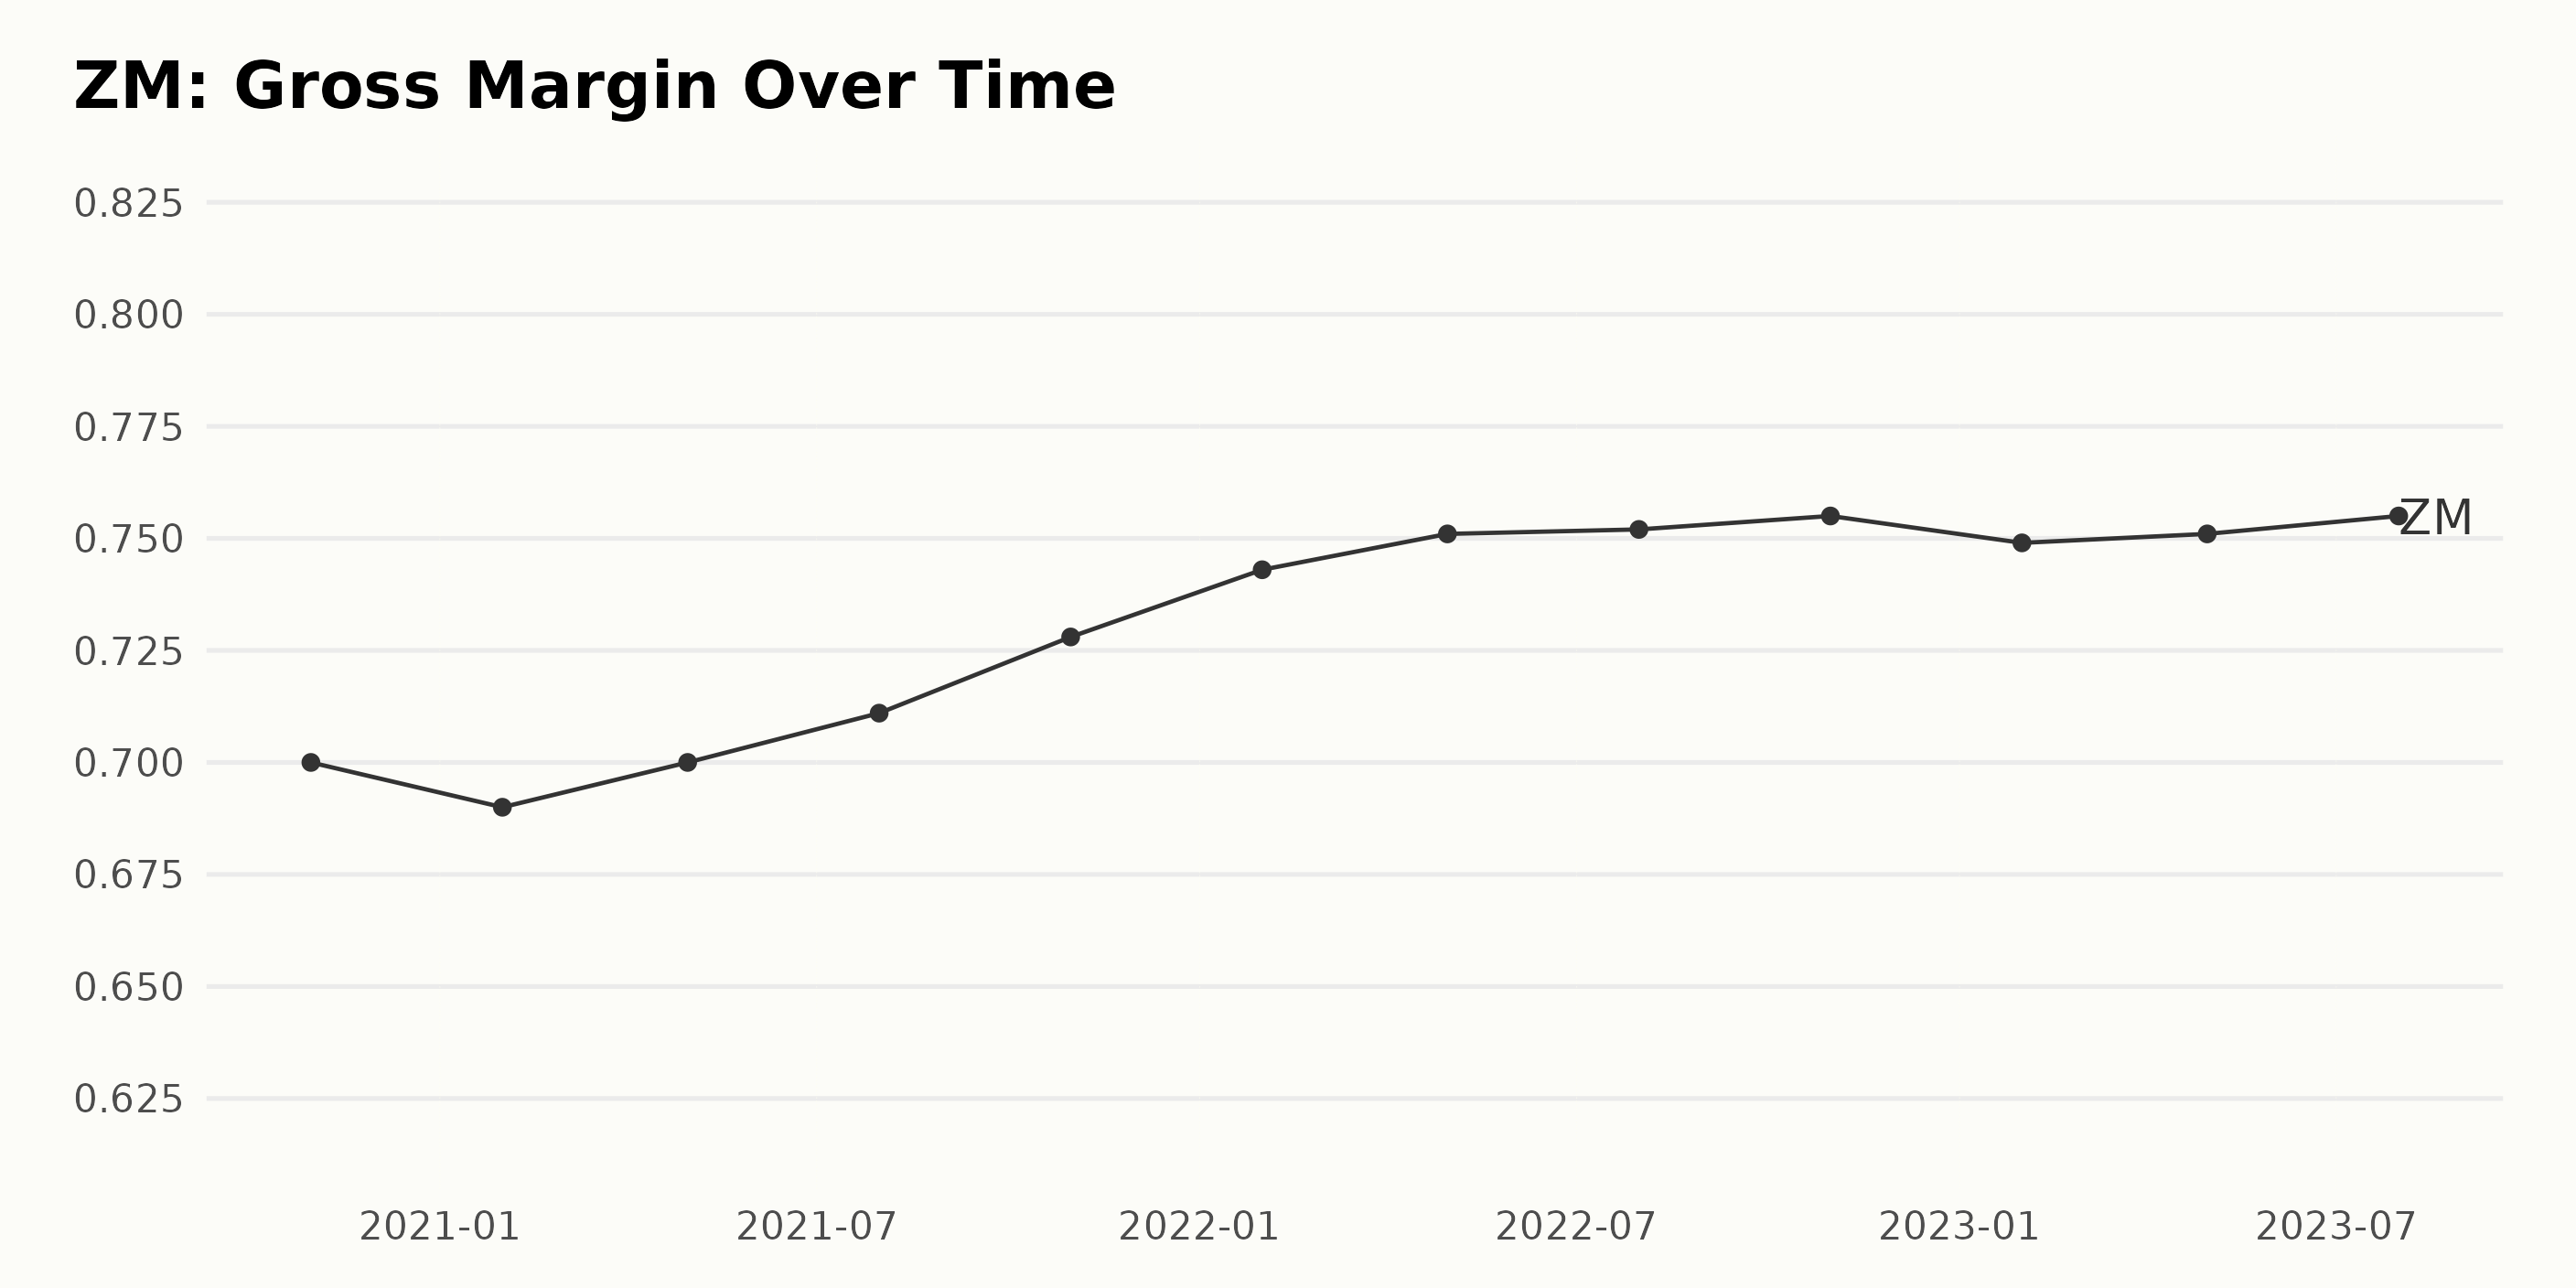
The gross margin for ZM shows an overall upward trend over the evaluated period. Here is a summary of the percentage fluctuation over time:
- October 2020: 70%
- January 2021: 69%
- April 2021: 70%
- July 2021: 71.1%
- October 2021: 72.8%
- January 2022: 74.3%
- April 2022: 75.1%
- July 2022: 75.2%
- October 2022: 75.5%
- January 2023: 74.9%
- April 2023: 75.1%
- July 2023: 75.5%
Though the company experienced a slight dip in January 2021, it quickly recovered and maintained a consistent growth trajectory. The gross margin peaked at 75.5% in October 2022 and July 2023. From the start of the period in October 2020 (70%) to the end in July 2023 (75.5%), the growth rate indicates an increase of around 5.5%.
The last observed value in July 2023 was similar to the peak value reached in October 2022, offering a sign of consistency in the company’s gross margin over time. Despite minor fluctuations, the data depicts a positive upward trend for ZM’s gross margin in the given time frame.
Based on the comprehensive data presented, the current ratio of ZM has shown an overall increasing trend from October 2020 to July 2023, with some fluctuations in between.
- In October 2020, the current ratio was 1.86.
- It saw a significant increase by January 2021, reaching 3.80, and has remained above 3 since then.
- However, there were periods of minor drops: April 2021 (3.50), July 2021 (3.46), April 2022…
Read More: Is Zoom Video Communications (ZM) Worth Chasing in September?